This week Google Docs rolled out a new chart editor for Google Docs that makes it easier to share your data stored in a Google spreadsheet wiht others. The chart editor will note only help you figure out what chart to use, but you can now choose form more charts and embed the results on webpages.

The new chart editor brings organizational charts, gauges motion charts in addition to many others that give you a broader choice to use when showing your data to others. the new charts editor also helps you tell a story with your data by finding the best chart for your data set.
Finally, you can embed the charts in a web page with a bit of code, just like a YouTube video and the chart will be updated as you updata data. You can see an example below.
The new Google Charts can be found in your account or you can learn more at the Google Charts page.
Related Posts
-
If you're looking for a cheap laptop, it's hard to miss the wave of inexpensive Chromebooks. But…
-

Did you know that Chrome has its own task manager, entirely separate from the one…
-
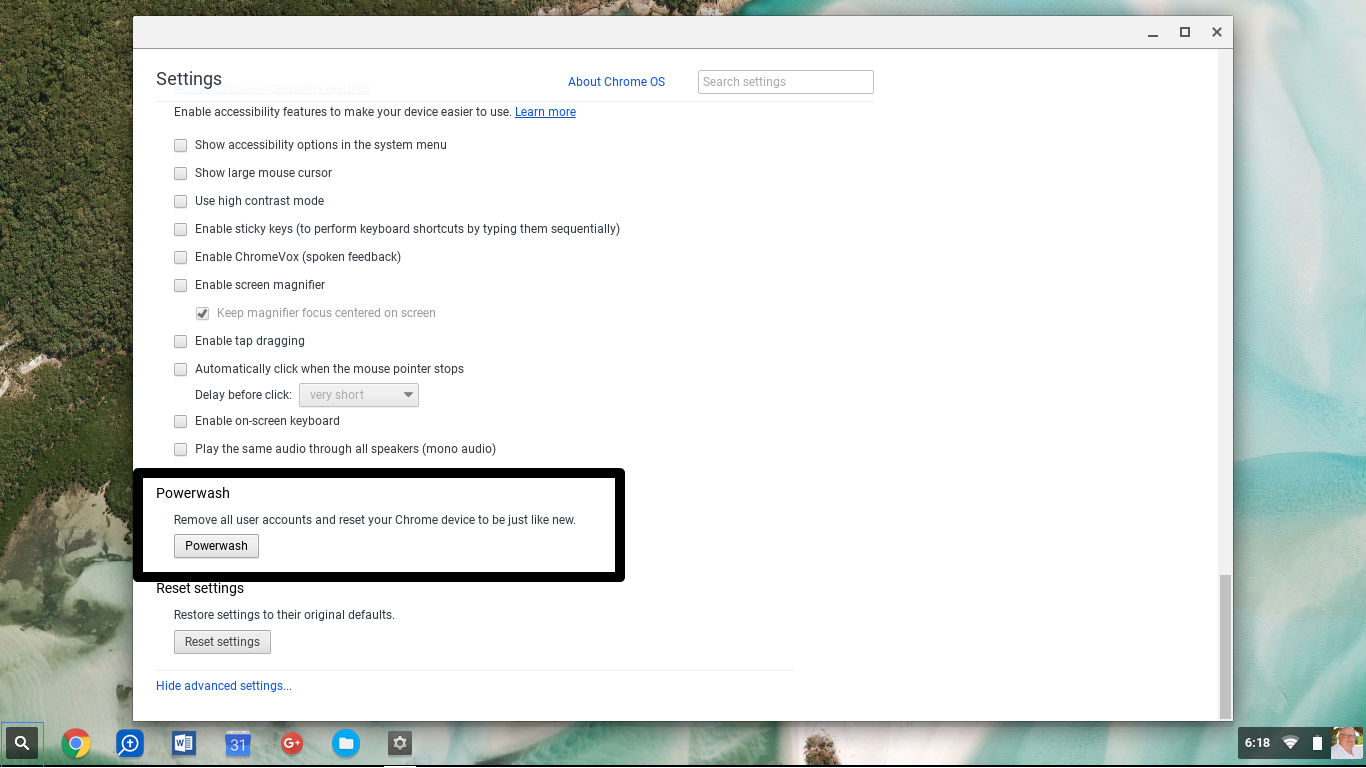
The process of erasing a computer and reinstalling the operating system and software can take…